Because “better communication” isn’t a business goal

This is Step 2 in our learning measurement framework for L&D impact. This step focuses on learning measurement and connecting learning activities to measurable business outcomes. Don't miss the rest of the series: Part 1:L&D can't be true business partners, Part 3: Think like a researcher, not a trainer, Part 4: Different problems, smarter solutions, better results, or Part 5: Learn the not-so-secret art of L&D storytelling.
The learning measurement disconnect undermining your data
You’ve started strong. You reframed a training request into a business need (See our Step 1 article on how L&D can't be true business partners). You’ve got stakeholders listening. Nothing could go wrong. Right? Wrong. This is where learning measurement connects learning to the outcomes the business actually cares about.
“How exactly will this lead to the business results we want?”
It’s a fair question, and a tough one to answer without a solid structure. When you can’t draw a clear connection between what people are learning and what the business needs, all you can rely on is your personal experience. Your answer may be correct, but you can’t show your work. You can’t explain How with a capital H.
So how do you get to that important How?
Derek Mitchell, Director of People Analytics at Gallus Insights explains:
“It’s the responsibility of L&D practitioners to understand the business metric they are aiming to influence before any work begins. Designing a learning solution without first identifying the target metric, and its baseline, is typically nothing more than a cost to the business. This includes the designer's time (and salary), the cost of development tools, the salaries of employees pulled away from their roles to attend training, and the productivity lost during that time. All of these are sunk costs if the learning team hasn’t clearly linked the intervention to a measurable business outcome”
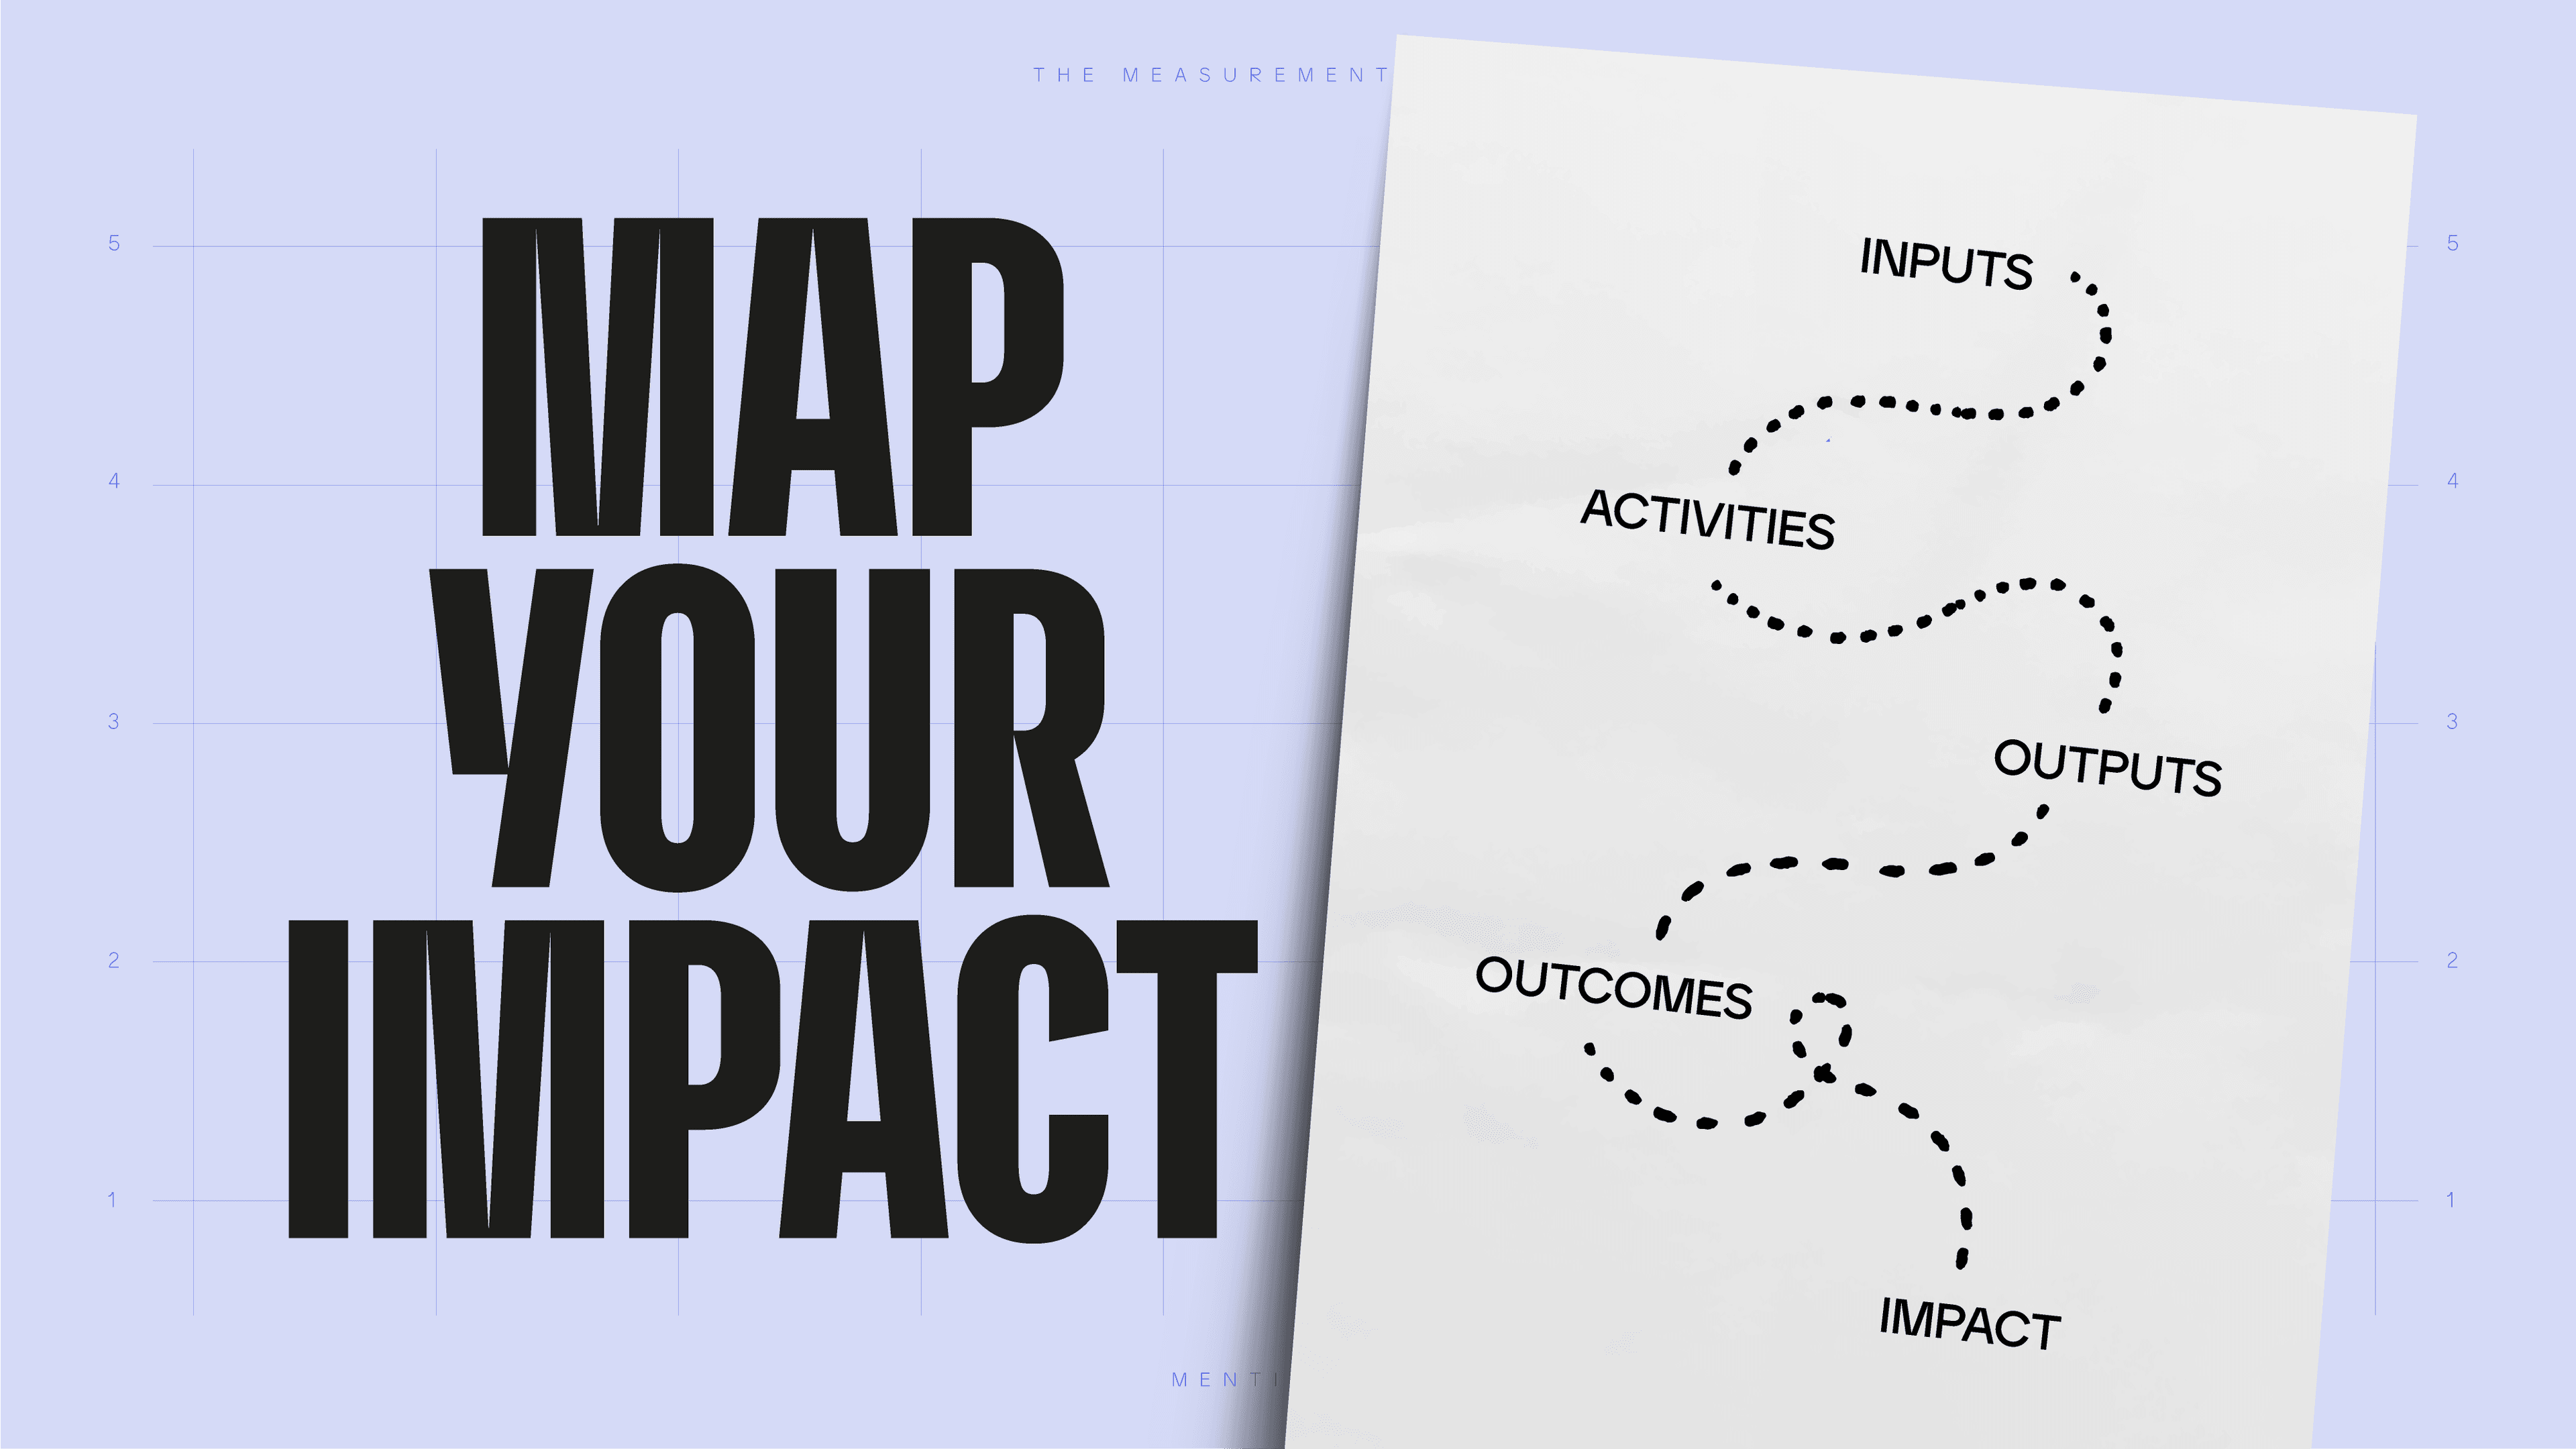
One way to reach that understanding is by building an impact logic map (also known as a logic model or measurement map). It’s not just a tool, but the structure that helps you say: Here’s how learning turns into performance.
But let’s not stop there when you’ve come this far. Without a clear structure, measuring L&D's effectiveness becomes guesswork. So, armed with your map, you only need one more question in your arsenal and you can avoid defaulting to training as the solution to everything.
What do you want people to do differently?
Part 2 Key Takeaways: How to measure learning in practice
- Start With the End in Mind To measure L&D impact, you need a clear outcome. Reverse-engineer your logic: begin with the business result, identify the behavior that drives it, and design learning to support that behavior. Don’t build anything until you’ve asked, “What does success actually look like?”
- Get Specific About Behavior Vague goals like “better communication” won’t cut it. Translate abstract intentions into observable, countable actions. If you can’t describe it in a way that could be caught on camera, it’s not measurable yet.
- Involve Stakeholders (And Their Metrics) Don’t go it alone. Co-create logic models with your business stakeholders and data teams. Use their language, define shared goals, and agree on what will be measured and why. This builds buy-in and shared accountability from the start.
- Focus on Signals, Not Just Stats: measuring L&D's effectiveness These signals are the backbone of training impact measurement. Completion rates and satisfaction scores are helpful but shallow. Track behavior change and performance outcomes to know whether learning is making a real difference. And don’t sweat the perfect attribution—L&D isn’t the only team influencing business results.
- Use Training Tools That Make It Easy Logic mapping, behavior tracking, and stakeholder engagement don’t need to be complex. With Mentimeter, you can design logic-driven sessions, gather real-time feedback, and track behavioral signals—all in one place. It’s impact made measurable, without the headache.
- Resources to explore
What is an Impact Logic Map? A learning measurement essential.
Think of it like GPS for your initiative. A logic map draws a straight line from your learning activity to the outcome your business cares about most. No detours. No guesswork.
Bonnie Beresford explains it with: “You’re not going to get the business result unless you can break it down into what employees are actually doing — and what they’re supposed to be achieving. Until then, you can’t build training that hits the mark.”
Here’s a way to visualize it:
The swimmer analogy
Your L&D logic map works the same way, connecting each element in a chain of cause and effect.
Imagine you’re coaching a swimmer aiming to win races. You wouldn’t just toss them in the pool and hope for speed. You’d build a plan:
- Business Goal: Win more races (faster times)
- Leading Behaviors: Better stroke technique, stronger kicks
- Learning Interventions: Technique coaching, video analysis
- Logic Map: If we improve stroke efficiency (behavior) through targeted coaching (intervention), the swimmer reduces drag and gains speed—leading to faster race times (impact).
That’s the level of clarity you want for your L&D initiatives.
Ask better questions. Get better maps.
Asking sharper needs assessment questions is how you move from assumptions to insights. Lori Niles favors a direct approach “What is the evidence of need? Gut feeling isn’t enough. If someone says, ‘I noticed this,’ ask: ‘How many? Who? When?’ That’s how you get real insight.”
But sometimes the challenge is knowing where to start the conversation. You don’t always have a direct rapport with your stakeholders and sponsors. Robert Brinkerhoff advises:
“Use ‘Why is that important’ questions to navigate to the right (toward results) on the impact map, use ‘How could they make that happen’ questions to navigate to the Left portion of the impact map (toward learning outcomes and behaviors)...
Keeping the generic impact map structure in mind, begin to ask questions about what the client sees as the principal goal for the training. ‘Locate’ their answer in your impact map framework: if they say something like ‘Our service technician managers need to be better at managing conflict,’ that information is located on the far-left portion of the impact map. To get more information towards the results and behaviors portion of the impact map, ask ‘I see, they need to know more about conflict resolution. Why is that important?’ This forces identification of outcomes and results that are needed.
If they start well to the right as they answer your question, for example they say: ‘We need to improve our market share’ (a long range goal), then ask ‘Ok, market share: Who needs to do what to make that happen (a How question).’ This forces the information to move toward the left: actions and learning outcomes.”
This is where the map becomes more than a diagram and turns into a tool for strategy, clarity, and alignment.
The five levels of a logic map: from activities to L&D impact
Every strong impact logic map includes five layers:
- Inputs: Time, budget, tools, facilitators
- Activities: What the intervention involves (e.g., workshops, coaching)
- Outputs: Immediate, measurable results (like completion rates, satisfaction scores)
- Outcomes: Observable changes in behavior or performance
- Impact: Tangible business results
Each level builds the foundation for effective learning measurement and demonstrates how learning translates into business performance.
The key insight: Most organizations measure inputs, activities, and outputs, but skip the crucial outcomes level that predicts business impact. Use quick tools like training survey questions to surface real evidence of need, instead of relying on gut feeling.
If you're feeling overwhelmed by slow or fuzzy results, Robert Brinkerhoff offers this grounding advice:
“Keep your focus on near-term results, versus longer range goals. All L&D results begin with changes in on-job behaviors. Focus on these. If they do not take place, long range goals will never be realized. On-job behavior change is relatively easy to measure, and will do your clients the greatest good, as getting performance to improve is always a challenge.”
It’s a reminder that impact doesn’t have to mean distant KPIs. Often, the most valuable shifts happen close to home—in the day-to-day habits that drive performance.

Barrier 1: "We struggle to define behavior change"
The challenge
L&D teams often describe desired changes in vague terms:
- "Better communication"
- "More leadership presence"
- "Improved customer focus"
- "Enhanced collaboration"
They sound good, but they don’t mean much until we translate them into actions. You can’t measure “better communication” if you don’t know what it looks like. You can’t improve “collaboration” if you can’t describe what’s missing.
This is one of the most common breakdowns in L&D: vague goals, unclear outcomes, and no way to track what’s actually working. As Bonnie Beresford puts it, “Before we build anything, I ask: ‘What do you want people to do differently?’ If stakeholders can’t answer that, we pause — because we’re not ready. The behaviors drive the business results, and without that clarity, we’re guessing.”
Why this happens
It’s not a lack of effort. It’s a mix of old habits and fuzzy conversations:
- Abstract thinking – Learning objectives often stay conceptual
- Stakeholder language – Business partners use broad terms
- Training tradition – L&D has long centered knowledge transfer, not behavior change
Stephen O’Brien lays it out clearly:
“Invest time in answering these questions, preferably before the LJ starts but I have seen them implemented during a LJ with success.
- What’s the problem being addressed?
- What will people be able to do better or differently after the training program?
- When will results be visible and who will see them? How is success measured? What factors will help or hinder application of skills?
I know of organisations who refuse to engage in content development if these questions can’t be answered by the sponsor. These answers provide a guideline that can be used to know when and where to apply measurements. It also highlights those who should be held accountable for results during the LJ.”
The solution: Measure learning and make behaviors observable and countable
Time to turn theory into action using the SMART-B framework:
- Specific: What exactly will people do?
- Measurable: Can you track frequency or quality?
- Achievable: Is it realistic based on your learning design?
- Relevant: Does it move the business needle?
- Time-bound: When should you see this change?
- Behavioral: Is it something you could see on camera?
This simple shift changes everything. Here’s how:
Before and after examples
| Abstract Goal | Observable Behavior |
|---|---|
| Better communication | Managers hold weekly 1-on-1s with their teams |
| More leadership presence | Team leads speak up twice weekly in meetings with concrete proposals |
| Improved customer focus | Sales reps ask 3+ discovery questions before pitching a solution |
| Enhanced collaboration | Project teams post milestone updates in shared channels within 24 hrs |
Practical ways to get there
- Run the “Camera Test”: If you filmed your team, what would they be doing differently?
- Ask “What would that look like?”: Turn stakeholder language into visible action.
- Reverse-engineer from KPIs: Start with the result, then map back to behaviors.
Julie Trell uses a people-first, real-time approach to build this clarity:
“In my workshops, which use applied improv (the other AI), I pay close attention to participants' behaviours in real time. We use non-leading debrief questions to help them connect what just happened to their everyday work. You can often see a shift right there in the room—but real change doesn’t stop when the workshop ends. That’s why I build in follow-ups—whether it’s reflection prompts, peer check-ins, or playful nudges—to help turn insight into sustained behaviour.”
This is what thoughtful learning design looks like. It's not just what happens in the session, it’s what sticks afterward.
Tool: Behavior definition worksheet
Give your team a head start with this simple worksheet:
Business Goal: ______________________
Abstract Description: ______________________
Observable Behaviors:
- People will _________________ [specific action]
- With frequency of _____________ [how often]
- Measured by _________________ [counting method]
- Within timeframe of __________ [when to expect it]
Example:
- Business Goal: Reduce customer churn by 15%
- Abstract Description: "Better customer relationship management"
- Observable Behaviors:
Barrier 2: "We focus too much on training inputs"
The challenge – to measure training effectiveness in organizations
It’s easy to track how many people showed up. Or how long the session lasted. Or how satisfied learners said they were.
- 500 completions
- 4.2/5 satisfaction
- 95% attendance
- 40 hours delivered
But those numbers don’t tell you if anything actually changed. They’re delivery metrics. They tell you what was done, not what it did. Learning measurement works best when linked to behaviors, not just completions.
Why this happens
Let’s be fair: input metrics are the default for a reason.
- They’re automatically captured by LMS tools
- They provide instant feedback
- They match what training teams have always reported
- And, truthfully, many stakeholders still ask for them
But here’s the problem. These numbers don’t show impact. They show activity.
As Derek Mitchell explains:
“For analysts, mapping activity to impact is relatively straightforward, but only when there is a clear, singular business metric that the intervention is designed to influence. In practice, however, instructional designers often don’t know what metric they’re aiming to shift, which makes meaningful measurement virtually impossible.”
Bonnie Beresford offers a practical frame:
“The goal isn’t perfect measurement. It’s directional evidence. Did behavior change? Are we seeing early signs of improvement? That’s more powerful than a satisfaction score — and way more useful for decision-making.”
The solution: Shift from delivery metrics to performance signals
Traditional training evaluation often stops at satisfaction scores, but that misses the performance story. If you want to move the needle on business goals, your metrics need to climb the ladder.
The measurement hierarchy
Level 1: What we did (Delivery metrics)
- Completion rates
- Satisfaction scores
- Hours of training delivered
- Number of participants
Level 2: What people gained (Learning metrics)
- Knowledge assessments
- Skill demonstrations
- Confidence measures
- Capability improvements
Level 3: What people did differently (Performance metrics) ← This is where impact lives
- Behavior frequency changes
- Quality improvements
- Process adherence
- Tool usage
Level 4: What the organization gains (Business metrics)
- Revenue increases
- Cost reductions
- Quality improvements
- Customer satisfaction
Inputs vs. outcomes comparison table
| Traditional focus (Inputs/Outputs) | Performance focus (Outcomes/Impact) |
|---|---|
| 200 managers attended leadership training | 85% of managers now conduct monthly team meetings |
| Customer service workshop had 4.3/5 satisfaction | First-call resolution improved from 67% to 78% |
| 40 hours of sales training delivered | Average deal size increased 12% quarter-over-quarter |
| 95% completion rate on compliance course | Safety incidents decreased by 30% in 6 months |
How to put training impact measurements into practice
- Build a “So what” chain
Don’t stop at reporting what happened. Keep asking “So what?” until you reach a business outcome.
- We trained 200 people → So what?
- They gained new skills → So what?
- They're using those skills on the job → So what?
- Customer satisfaction improved → So what?
- We retained more customers and increased revenue → Now we're talking business impact
This balanced view is core to measuring training effectiveness in organizations and demonstrating true L&D value.
2. Balance Your Dashboard: Include delivery metrics for operational management, but lead with performance and business metrics for stakeholder communication.
3. Use Leading and Lagging Indicators: Track behavior changes (leading) that predict business results (lagging). This gives you early signals of success and helps you course-correct quickly.
Many L&D teams hesitate to even start measuring impact, especially when they can’t isolate their influence on business metrics. Joost Hoogwaerts offers a reality check:
“No business team can fully isolate the impact of their work on a business metric, so why do we think L&D should? Track the business metric (level 4) you want to impact before and after deploying your learning solution. Use your supporting metrics (1. reaction, 2. learning and 3. behavioral change) to prove the likelihood that your learning solution impacted the business metric.”
The key is not to prove causality, it’s to show credibility. Link your work to business impact using logic, evidence, and strong signals of change. As Derek Mitchell also points out:
“Measurement only becomes difficult when we’re unclear on what we’re trying to change. The most important question practitioners can ask at the outset is: ‘Once this training is complete, what outcome matters most – behaviour change, skills growth, culture shift, performance improvement, or human network expansion?’ Once that question is answered, the next step is simply identifying a metric within that domain.”
He also highlights what helps measurement efforts get stakeholder buy-in:
“The key to securing stakeholder support for measurement efforts is to link them directly to their own performance. If you can demonstrate that measuring impact helps highlight the value the requester has brought to the business, and that this value influences their own bonus, you’re pushing on an open door.”
And finally, don’t go it alone:
“L&D teams must also build strong relationships with data teams across the organization, these are often the gatekeepers of the data needed to demonstrate value. That said, with thoughtful planning, L&D may only need one well-chosen dataset to prove impact.”
Barrier 3: "Stakeholders want impact but can't define what good looks like"
The challenge – aligning learning measurement with business outcomes
“We need better performance.”
Okay. But what does that actually mean?
When stakeholders ask for “improvement” or “change” without defining the destination, you hit a wall. You can’t measure what you can’t describe. And if you don’t know where you're going, how do you build a path to get there?
It’s a measurement paradox. Everyone wants to measure impact, but no one agrees on what “impact” looks like.
Why this happens
- Assumption gaps: Leaders assume everyone already understands what “better” means
- Conflicting definitions: Different departments see success through different lenses
- Lack of data: The metrics that really matter might not even be tracked yet
- Vague ambition: “Significant improvement” sounds great… until you ask, “Compared to what?”
This is where L&D needs to slow the process down before rushing into design. As Joost Hoogwaerts puts it:
“Reverse it: go from the desired results, to desired behaviors that are needed to achieve that result, to a learning solution that helps develop those behaviors (I like using the 8 field instrument by Kessels & Smit). This is hard when your stakeholder already has the learning solution in mind, so this is where it is important to pause and ask the right questions before you start building.”
The solution: Co-create logic models with stakeholders
A logic model built in isolation is just a guess. But when built together – with input, clarity, and alignment – it becomes a shared roadmap. Bonnie Beresford emphasizes this point: “Invite your business stakeholders into the mapping. When they define what success looks like — and what data proves it — they become co-owners. They even help you get access to the right metrics.” Co-creating what "good" looks like turns alignment into L&D impact that lasts.
But don’t stop there, bring your analytics partners into the process early. As Joost Hoogwaerts advises:
Good L&D business partners don’t just rely on their stakeholder to give them access to business data. Involve your analytics team early on, to ensure you get access to timely and relevant data to report on the success of your learning solution.”
These teams often hold the keys to the data you need. Don’t treat them as gatekeepers – treat them as collaborators.
This also helps solve one of the toughest L&D challenges: defining success in a way that’s actionable and measurable.
Bonnie Beresford shared a great example: “A restaurant wanted to boost revenue. We didn’t just train them on sales. We found that servers weren’t offering dessert, weren’t upselling wine, and weren’t asking about food allergies. That’s what we trained. And when dessert sales and wine orders went up, we knew it was working.”
The logic model workshop process
Pre-Workshop Preparation (1 hour):
- Gather any available baseline data
- Interview 2-3 key stakeholders individually
- Collect sample logic models from similar projects
Workshop Agenda (2-3 hours):
- Align on the business problem (30 minutes)
- Define success together (45 minutes)
- Map the behavior chain (60 minutes)
- Design the logic model (30 minutes)
- Plan next steps (15 minutes)
Workshop tips
- Draw it out: A visual map makes the abstract real. Use whiteboards, sticky notes, shared screens—whatever works.
- Keep asking “How do we know?”:: Turn assumptions into measurable points.
- Challenge softly: If someone says “People don’t do X,” ask: “How do we know that?”
- Test the logic: Walk it from end to end: “If we do A, what leads to B? And what could block that?”
- Work together: When you're missing data, go to the source. If onboarding metrics are missing, co-create them with HR to define what good looks like.
The goal here is not to just define impact. It’s to make sure everyone owns it, and knows how to see it happening.
Sample Logic Model Template
You can use this template during your workshop:
BUSINESS GOAL: [Specific, measurable business outcome]
↑ (caused by)
PERFORMANCE INDICATORS: [Observable changes in work results]
- Metric 1: [Current: X, Target: Y, Timeline: Z]
- Metric 2: [Current: X, Target: Y, Timeline: Z]
↑ (caused by)
BEHAVIOR CHANGES: [What people will do differently]
- Behavior 1: [Specific, observable action]
- Behavior 2: [Specific, observable action]
↑ (caused by)
LEARNING INTERVENTION: [What we'll do to enable behavior change]
- Component 1: [Training, coaching, tools, etc.]
- Component 2: [Support, reinforcement, etc.]
Real Example: Customer Service Logic Model
BUSINESS GOAL: Reduce customer churn by 10% (from 15% to 13.5% annually)
↑
PERFORMANCE INDICATORS:
- First-call resolution: 65% → 80% within 6 months
- Customer satisfaction scores: 3.8 → 4.2 within 6 months
↑
BEHAVIOR CHANGES:
- Reps use active listening techniques in 90% of calls
- Reps ask clarifying questions before offering solutions
- Reps document resolution steps in CRM within 2 hours
↑
LEARNING INTERVENTION:
- 2-day active listening and problem-solving workshop
- Weekly manager coaching sessions for 8 weeks
- Updated call scripts and troubleshooting job aids
- Peer observation and feedback program
Building Stakeholder Buy-In
Make them co-authors: When stakeholders help shape the logic model, they don’t just sign off on it, they believe in it. Involve them early, often, and meaningfully. Shared creation builds shared commitment.
Speak their language: Don’t introduce a new vocabulary when theirs works just fine. Mirror the terms and metrics they already use in boardrooms, dashboards, and quarterly reviews. Familiarity builds trust.
Address their concerns: If they’re worried about a specific risk, don’t dodge it. Design for it. Bake in the right checkpoints, validations, and success signals to reassure as you go.
Create shared accountability: Make measurement a team sport. Define who tracks what, when, and how. That way, responsibility isn’t blurred and everyone knows what they’re accountable for.
Putting It All Together: Your Logic Map Checklist to Measure Learning Reliably
Before finalizing your impact logic map, ensure it passes these tests:
Clarity Test
- [ ] Could someone outside your organization understand the connections?
- [ ] Are all behaviors observable and countable?
- [ ] Are timeframes realistic and specific?
Logic Test
- [ ] Does each level logically lead to the next?
- [ ] Are there any missing links in the chain?
- [ ] Could alternative explanations account for the results?
Feasibility Test
- [ ] Can you actually measure what you've proposed?
- [ ] Do you have access to necessary data sources?
- [ ] Are stakeholders committed to providing data?
Value Test
- [ ] Would achieving these outcomes meaningfully impact the business?
- [ ] Are the expected results worth the investment?
- [ ] Does this align with broader organizational priorities?
Mini activity: Draw your logic line
“Draw it out. Don’t just talk in theory. A visual logic map brings the abstract into focus — and helps everyone see the same picture. Once they see it, they start owning it.” - Bonnie Beresford
Time needed: 10 minutes
Your challenge: Can you draw a straight line from your learning intervention to business results?
Instructions:
- Pick a real project, something current or coming up.
- Grab a sheet of paper (or a whiteboard, or a Menti slide. Your choice).
- Draw five boxes in a row, connected by arrows. → Activities → Behaviors → Performance → Business Impact
- Fill each box with clear, specific examples.
- Ask yourself:
If you hit a wall, great. That’s where your work starts. Each stuck point is a signal to revisit your logic and strengthen the chain.
Your next steps – turn measurements into L&D impact
Immediate actions:
- Schedule a logic mapping workshop with stakeholders for your next big initiative
- Audit your current measurement approach – are you tracking behaviors or attendance?
Pick your hero metric:
Not sure where to focus your measurement? Joost Hoogwaerts suggests:
“Choose a hero metric (=what is the metric you and your stakeholder care most about for this learning solution) during your needs analysis with your stakeholder. It is very unlikely that L&D is expected to be the only responsible team to impact a business metric (level 4). Your hero metric may in this case be level 3: behavioral change.”
This makes it easier to align, measure, and report back with confidence.
Connect to the complete framework:
- ← Previous step: L&D's Business Partner Problem
- → Next step: (Coming soon!)
- ↑ Template: Add The Impact vs. Activity Template to your workspace
Remember:
A strong logic map is more than a diagram, it’s your insurance policy against failed measurement. Build it right, and you’ll always know what’s working, why it’s working, and how to do it again.
Crea tu primer Menti gratis
Cómo empezar