Donuts for all Mentimeter users
Change the visualization layout of your questions. We’ve added the option to present the input from your audience as informative Spider Charts as well as stylish Donut & Pie Charts.
No necesitas tarjeta de crédito
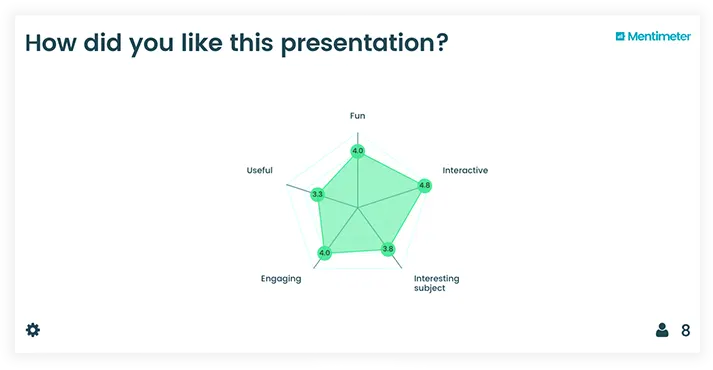
Spider Charts For your Scales questions
Spider Chart, also known as radar chart, is a much requested feature by Mentimeter users wanting a highly professional way to present the results to Scales questions. Use it to compare test scores, make product comparisons, or let your employees assess their own skills to see which areas they can improve in.
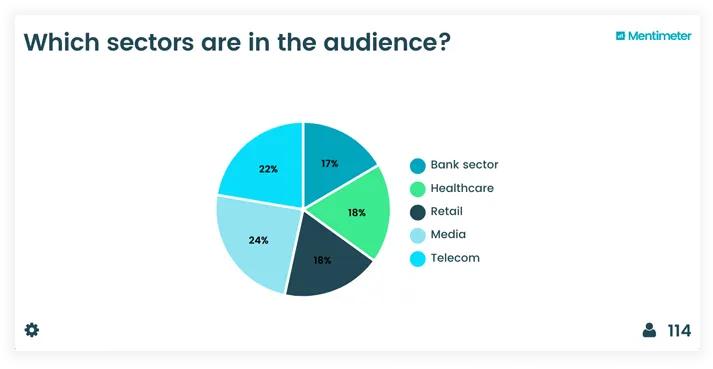
Donut & Pie Charts for your Multiple Choice questions
Make your Multiple Choice questions even more fun and make sure you get your point across by showing proportional data in different ways.
For a Multiple Choice question, you can now choose to present your audience’s input either as a Bar Chart, Donut Chart or Pie Chart. Just choose the result layout when you create the question. Pro tip: try voting on your question to get a preview of the results!
Try our new visualization layouts!
No necesitas tarjeta de crédito