The graph of a function
This Mentimeter template could be used as a continuation after applying the module "The concept of a function" but also works on its own. The template elaborates how functions could be visualized and understood with a graphical representation. The template is designed foremost as an introduction but can also be used in the middle or as a form of reinforcement at the end of a subject block surrounding linear functions.


How to use the template
The students need a pencil and paper for some of the questions in the presentation.
Here follows some ideas on how the slides are intended to be used, but feel free to use the template however you like. Included in each section of this page is the purpose and other information that may be of use for you as a teacher. A general idea regarding all slides is that the students should work under a Think-Pair-Share (TPS) model. When implementing TPS the students should first answer the question individually, then discuss in pairs (or groups of three) followed by a classroom discussion. As a concluding remark. The content in the slides are designed primarily for developing the students understanding of mathematical concepts rather than the procedural "know how". Therefore discussions and questions from the students is a central part of using the presentation where your expertise as a teacher is central to clarify misconceptions and lead the classroom discussions.
Theoretical background
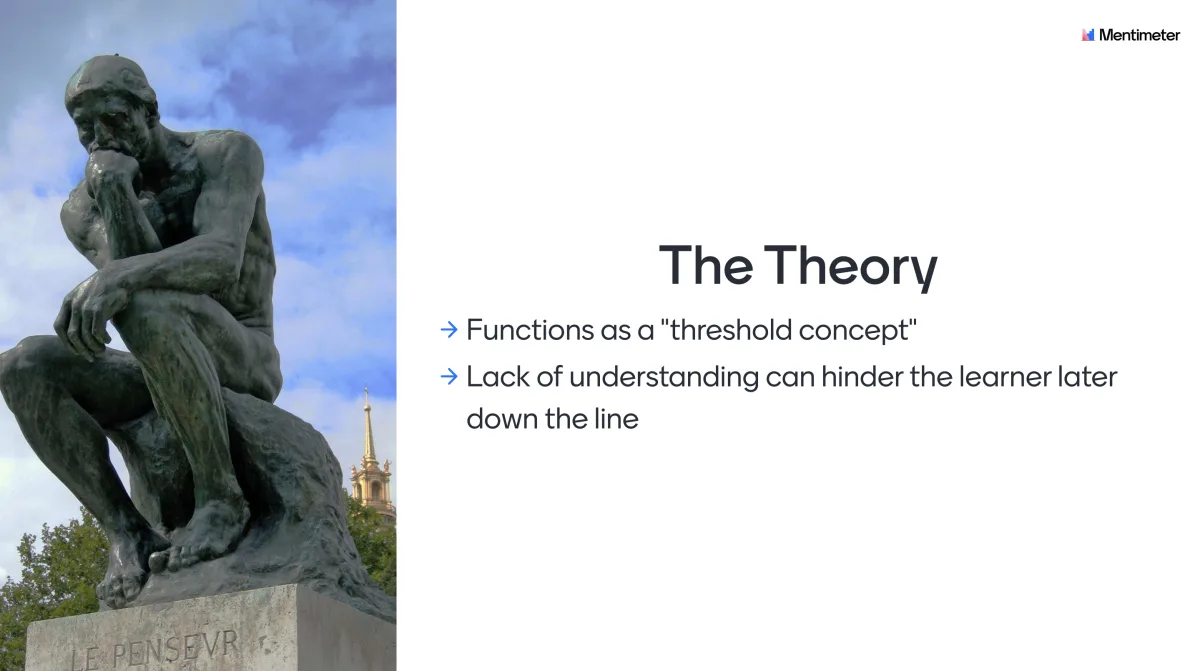
A function is defined as a threshold concept. This means that it is transformative - once learnt it opens up new ways of conceiving a concept and it will be impossible to forget. Not grasping the concept of a function will hinder the learner to get a rich mathematical understanding later down the line.
Students sometimes make conceptual mistakes when interpreting graphic representations of functions. To truly understand a graph correctly the students could benefit from a thoughtful design of the learning software in combination with a deeper mathematical knowledge. This template could therefore facilitate the understanding of functions represented by graphs but requires some mathematical knowledge in order to link the learning possibilities with the template's content and desired outcomes.
Slide 1 - The graph of a function: Introduce the theme of the lecture. For example you could mention that the graphical representation of a function is very central to mathematics.
Slide 2 - General information: Inform the students regarding the TPS methodology and how they can access the presentation.
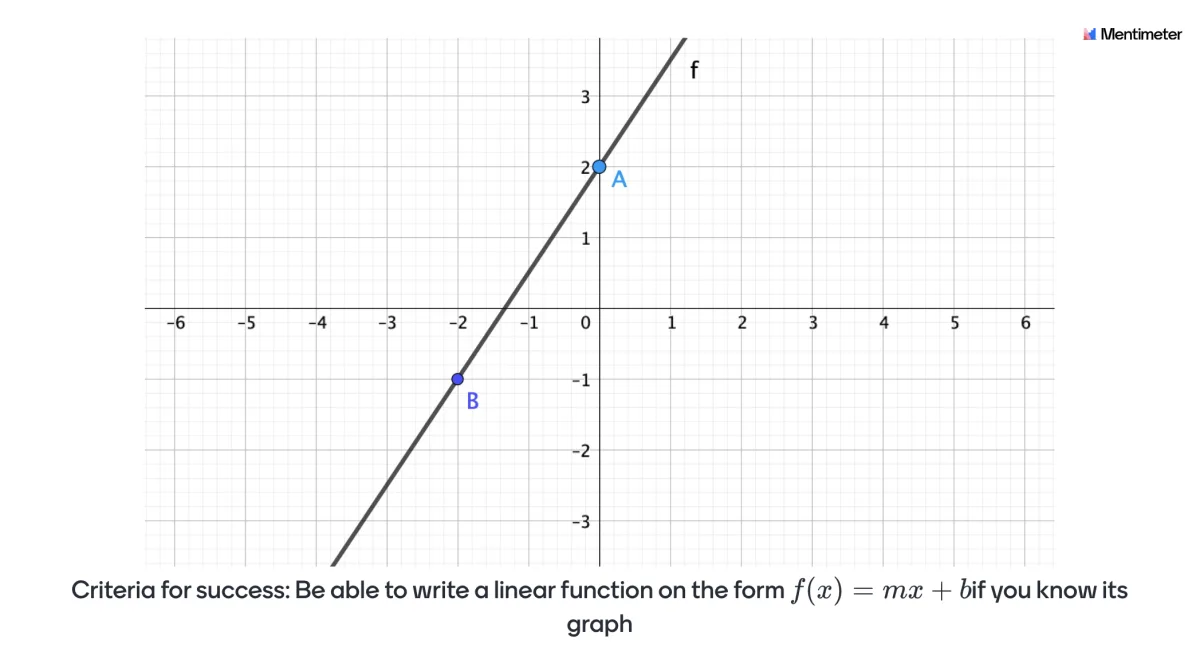
Slide 3 - Criteria for success: Introduce a "criteria for success" for the lesson with a problem that will be revisited and solved at the end of the lesson. The idea here is to make the learning visible, so the students can see for themselves that they’ve actually learned something.
Slide 4 - According to the students, a graph is...: Let the students individually write down how they conceive the concept of a graph. This can help clarify potential misconceptions.
Slide 5 - Where would you like to place the banana?: The students should realize that the banana should be placed in a specific position depending on the relationship between the y-axis and x-axis as a warm up.
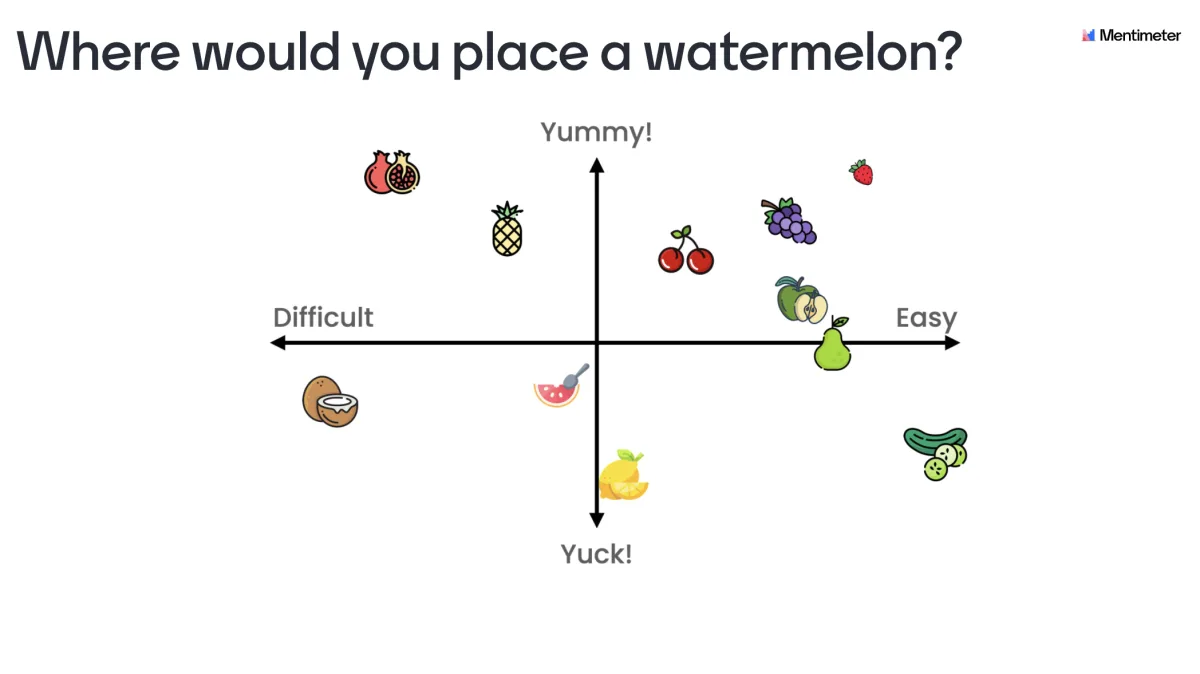
Slide 6 - Where would you like to place the watermelon?: The students get another opportunity to practice the idea of placing the watermelon in a specific position depending on the relationship between the y-axis and x-axis.
Slide 7 - Where is the treasure located?: The thought here is to get the "aha" feeling in understanding the need of a uniform mathematical language. Specifically points in the x-y-coordinate system are given in the form (x,y) (not (y,x)).
Slide 8 - Where are the points located?: The students get an opportunity to reinforce the understanding of the (x,y)-representation with points.
Slide 9 - Function machine that takes x:s and gives y:s: This is a key slide. The slide builds upon the previous module ("The concept of a function") and links the "function-machine-methaphor" with the graphical representation.
Slide 10 - What value is -4 and 2 being transformed to by the function-machine?: This is a key slide. The idea here is to strengthen the intuition from the previous slide, specifically that a function could be represented and visualized with a graph.
Slide 11: What is the function of the machine?: This is a key slide. The idea here is to strengthen the two previous slides, specifically that a function could be represented and visualized with a graph.
Slide 12: Take the previous function f(x)=0,5x+1 and insert x=1...: The idea here is to reinforce the connection between a function and its graph. The idea here is to understand that a specific input (on the x-axis) for the function gives a specific output (f(x)=y on the y-axis) and that this is valid for any x.
Slide 13: The slope of a graph (“rise”/”run”): This is a key slide. The purpose is to understand that the m-value refers to the rate of change between x and y. The idea here is to gain a conceptual understanding rather than a procedural.
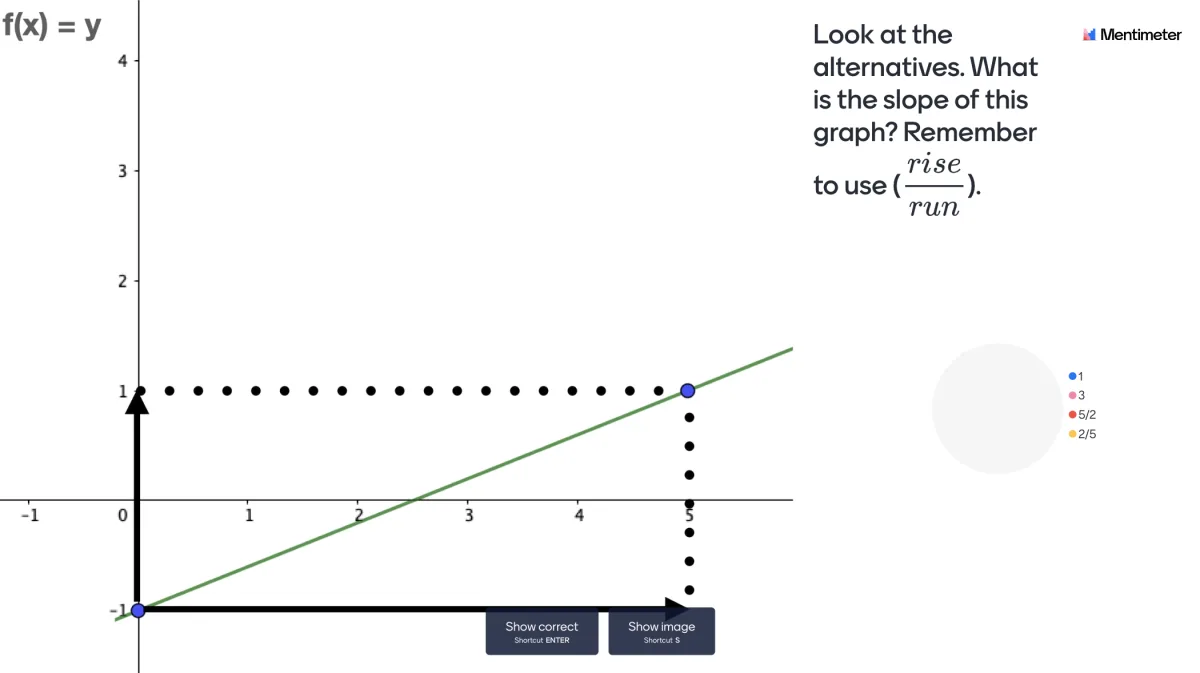
Slide 14: What is the slope of this graph?: Here the (rise/run)-concept is reinforced to strengthen the understanding of the m-value.
Slide 15: What is the slope of the two graphs?: Here we introduce the negative slope. The idea here is that the learner will gain insights about the challenges to apply the (rise/run)-concept to a negative slope.
Slide 16: What are the functions of the two lines?: By applying the (rise/run)-formula the student should be able to formulate the functions.
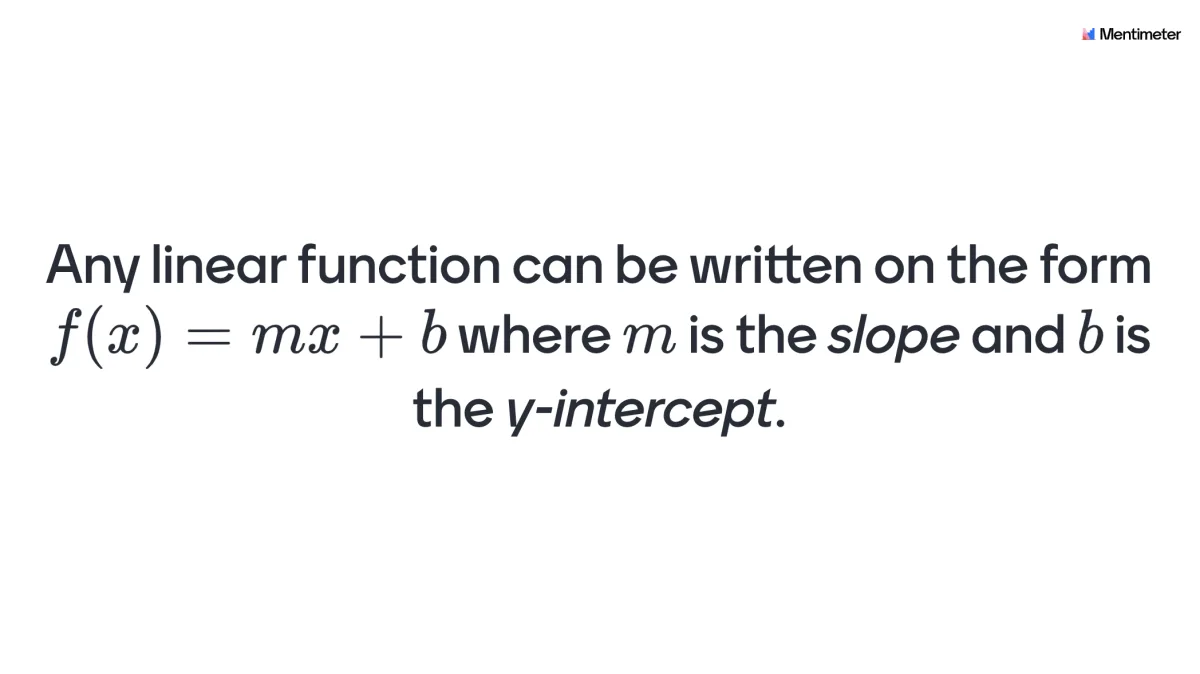
Slide 17: The formal expression of the linear function: “Introduction” to the formal definition of a linear function. Try to inform the students that the function is only depending on one variable (x) and that the m-value and the b-value are constants.
Slide 18: Altering the m- and b-value of a linear function: A video that shows what happens to a function in a visual representation when altering the constants m and b.
Slide 19: Write the three y-intercepts for the graphs: The idea here is to develop an understanding of the b-value or in other words the y-intercepts.
Slide 20: For any x, which function has the highest value respectively increases the most?: The purpose here is to give the student something to ponder with the intent of making them think about what increase really means in this context and idea of parallel lines.

Slide 21 - Criteria for success revisited: Return to the problem that was introduced in the beginning of the lecture to make the students realize they’ve actually learnt something.
Slide 22 - Q&A: Let the students individually write down what they still feel is unclear regarding the "graph of a function"
Slide 23-29 - Quiz Competition: Ask the student to enter their real names. Let the students compete in a fun way while you as a teacher can get a sense of the individual level of knowledge of different students. This information could be used to give extra support when needed.


